Dec 2025
As electrification accelerates and energy systems grow more complex, knowing when electricity is clean is becoming just as important as producing more of it. From its origins in Copenhagen, Electricity Maps has set out to build a global data layer that reveals the real-time carbon footprint of electricity everywhere, laying the digital foundation for a more flexible, transparent, and truly low-carbon energy system.
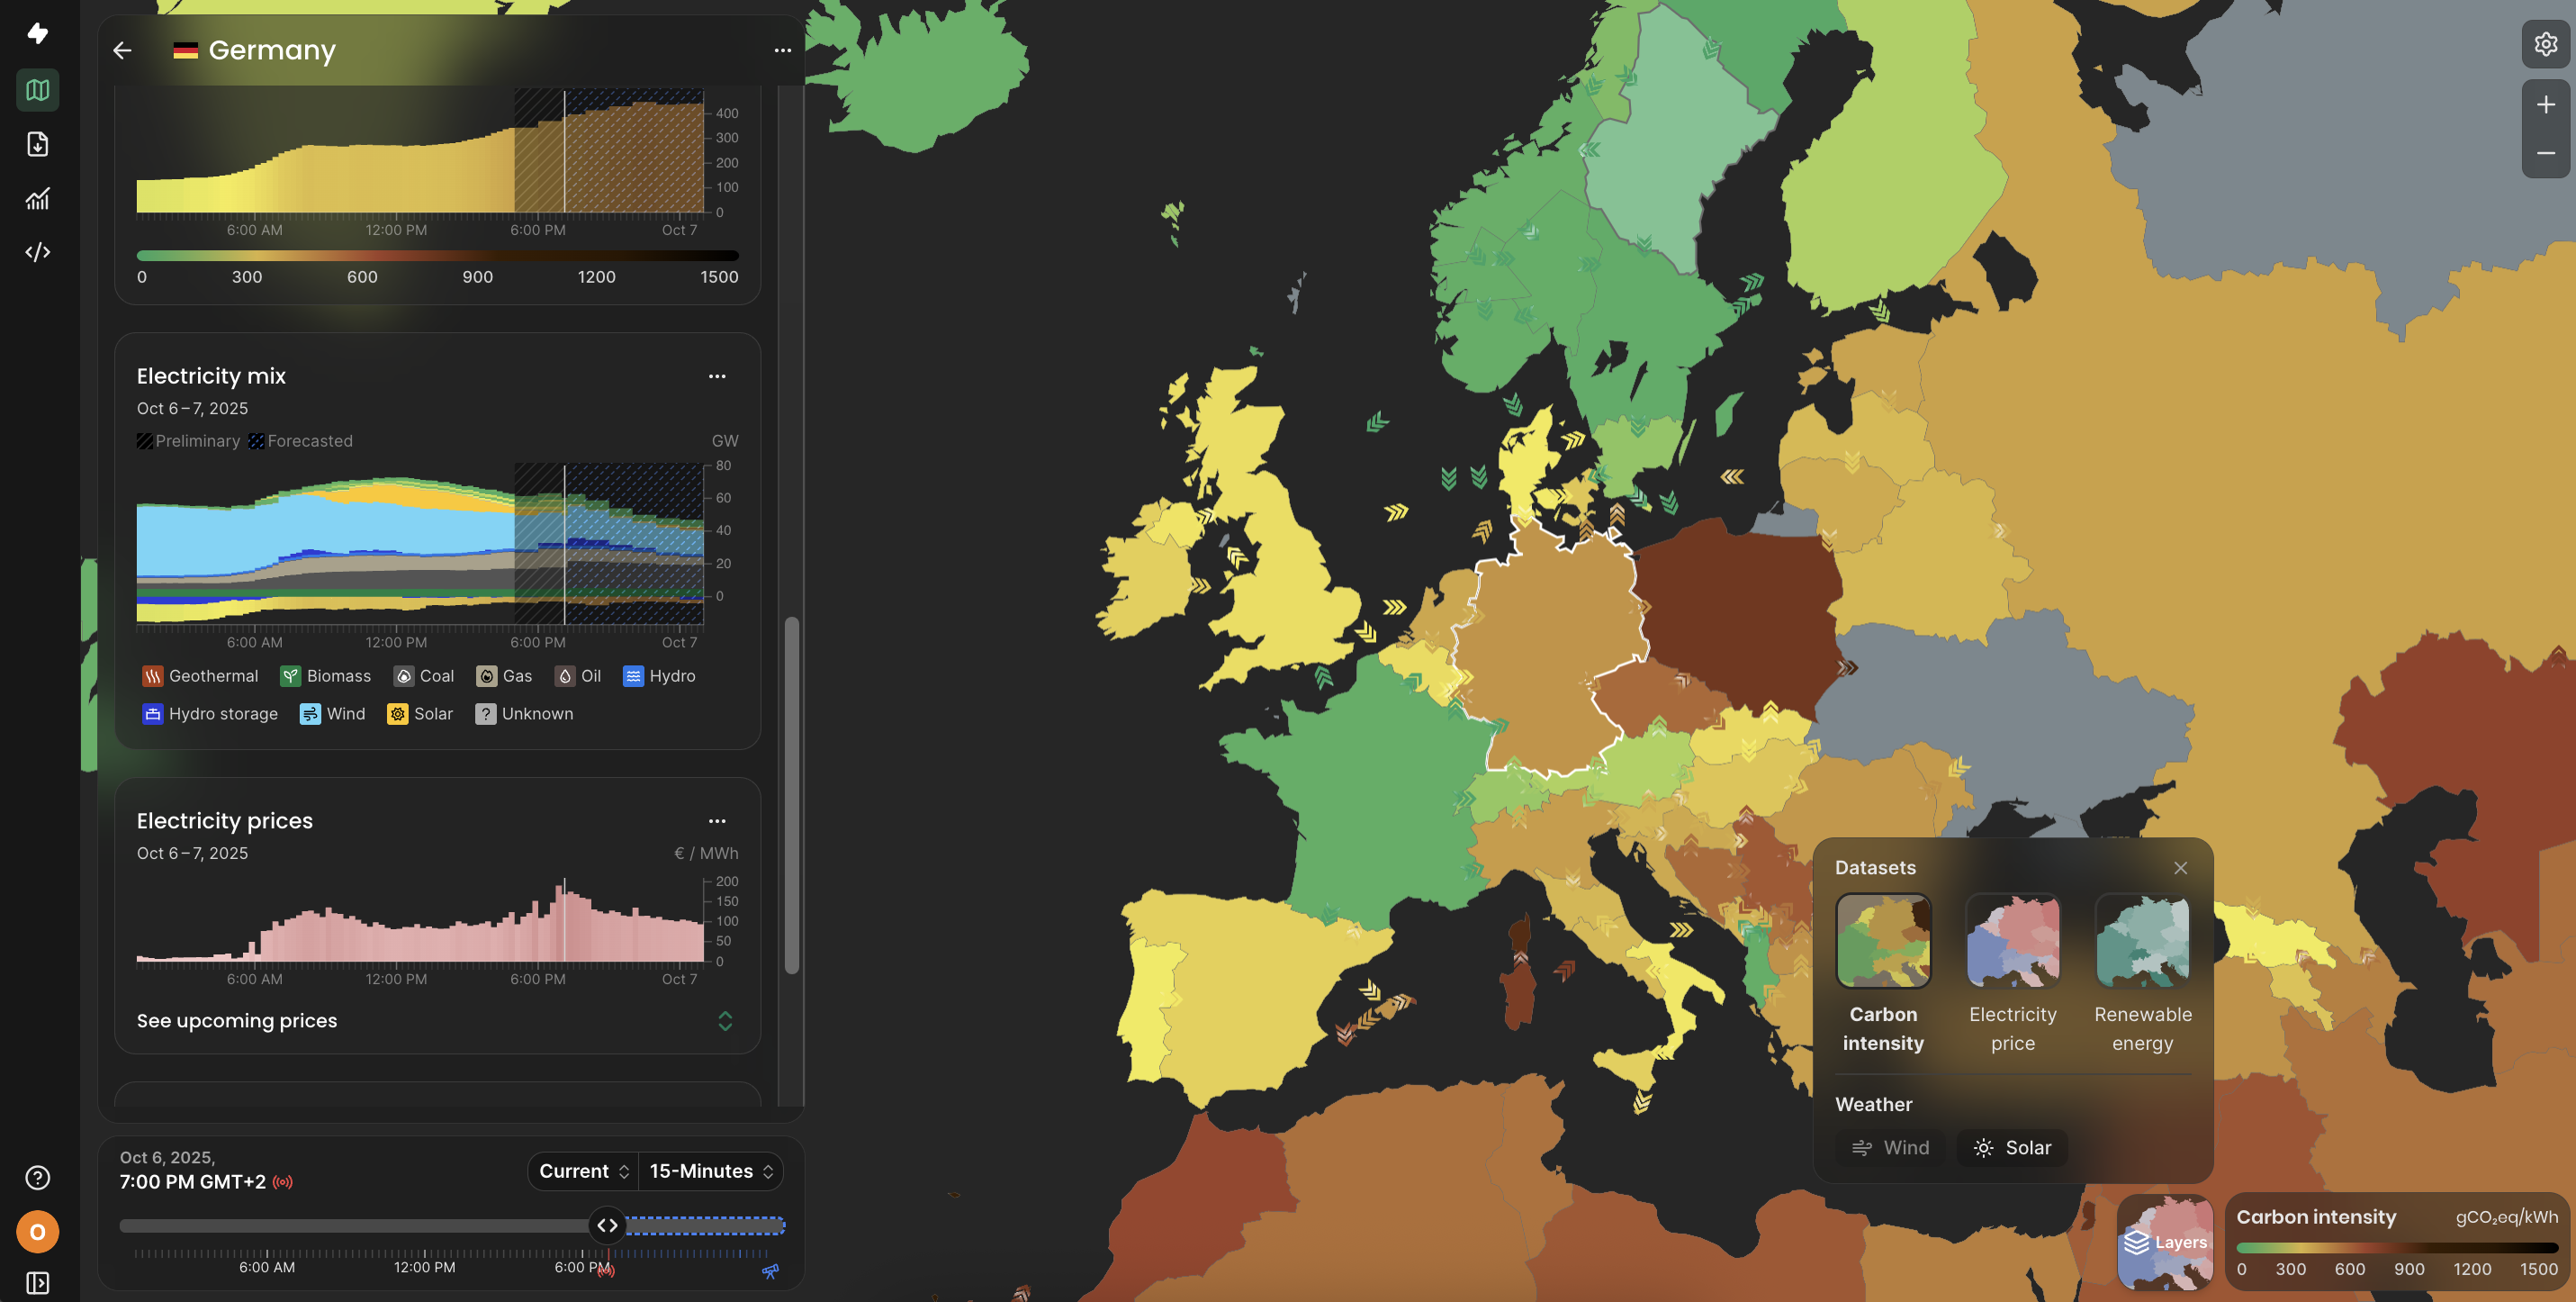
Electricity Maps began in Copenhagen nine years ago with a simple but radical idea: if the world is going to electrify everything, we first need to understand when electricity is actually green. Today, the company is one of the leading global platforms for real-time energy and CO2 intelligence, used by Microsoft, Google, Meta, Schneider Electric, and energy innovators worldwide.
For founder and CEO Olivier Corradi, the mission has always been to build a single API for the world’s electricity system, and a digital foundation for climate action based on transparent, high-quality data.
Corradi traces the origins of Electricity Maps back to his time as a student at DTU, working on algorithms to forecast wind production, long before Denmark became the renewable powerhouse it is today.
The problem was already clear: renewable energy varies dramatically over time. If societies want to electrify everything while decarbonising, then we must use electricity when it is cleanest.
“We must electrify everything, and we have to remove CO2 from all our production. But renewables fluctuate. So, the flexibility story of using electricity when it’s green makes sense,” Corradi explains.
Electricity Maps was built to establish a data layer that forecasts, verifies, and standardises the quality of clean electricity across every grid worldwide.
Reaching global coverage was a massive undertaking. By early 2024, the team could, for the first time, say that the platform covered the entire world, though they had to collect data with widely varying quality. In places like Denmark, real-time data from national Transmission System Operators (TSOs) is fast and high-quality. In countries like China, data barely exists, forcing Electricity Maps to model the electricity grid themselves.
And beyond data collection lies a deeper scientific challenge of communicating the uncertainty in energy data.
“There’s a whole science behind communicating uncertainty. Sometimes, even after two years, TSOs correct wind production data. We crunch all that complexity, so customers don’t have to,” Corradi says.
Today, the company has grown to about 30 employees and has had steadily growing revenue. After bootstrapping for most of its life, with support from business angels, Electricity Maps raised its first VC round two years ago to scale globally.
According to Corradi, Electricity Maps could not have started in France, despite his French–Danish background.
“What Denmark is uniquely good at is public–private collaboration. I could easily work with DTU, build foundational knowledge, validate it through research projects, and then take that to customers. In France, that would have been almost impossible.”
He highlights three ingredients that Denmark provides better than most countries:
Ironically, despite being the perfect development environment, Denmark was not the easiest commercial market. Electricity Maps went international almost from day one.

Scaling Electricity Maps from Denmark to Europe and, ultimately, to the rest of the world is not only a technical challenge but also a conceptual one. As soon as the company steps outside Denmark’s coherent data infrastructure, it encounters a fragmented landscape where basic energy concepts lack common definitions and where data structures differ dramatically from one country to the next.
Across Europe, the inconsistencies are striking. Countries disagree on what should count as biomass. Some TSOs publish high-quality real-time data, while others still upload static PDFs.
Platforms such as the European Network of Transmission System Operators for Electricity (ENTSO-E) attempt to harmonise these inputs but lack a mandate to enforce quality standards or resolve contradictory definitions. Even seemingly simple categories can be misleading coal burned inside a “biomass” plant may still be labelled as biomass.
As Corradi explains, “One thing is having data available. Another is agreeing on definitions. ENTSO-E has biomass categories that don’t match across countries, so sometimes we can’t use their platform at all. We need to pull directly from TSOs.”
For Europe, he argues, the challenge is fundamentally one of governance. There is no single institution empowered to ensure data quality, standardise definitions, or guarantee transparency across borders.
“A commercial actor may get there fastest,” Corradi says.
The long-term vision: one API that provides everything, from carbon intensity to prices, forecasts, and grid signals, on a global scale.
“If you’re a Danish battery operator and want to expand to Germany, you shouldn’t need to rebuild your IT systems. You just call our API and switch from Denmark to Germany. That’s the vision.”
The goal is to create a universal operating system for flexible assets for smart EV charging, battery storage, industrial demand-response, and future grid-aware devices. All seamlessly connected across borders on a single global data layer.
But he is realistic about the limits of technology alone. Consumer behaviour change, he argues, will not deliver the flexibility the energy system needs.
“Changing people’s habits is very hard. Better to set the right price signals and let smart devices optimise automatically. Then bring consumers in only when solutions are already easy,” he argues.
For example, today’s EV-charging optimisation is still a small market, not due to a lack of interest, but to a lack of meaningful price signals and volatility across most grids.
Europe cannot unlock digital and green transformation without fixing the foundations, such as shared definitions, open data spaces, and a clear mandate for harmonisation.
He points to Denmark’s model of open energy data, innovation funding, and research collaboration as a blueprint.
“The right approach is open data spaces that bring the whole ecosystem together for researchers, startups, industry, and citizens. That’s what worked in Denmark,” he adds.
Without aligned definitions and mandates across Europe, national silos will continue to produce incompatible energy data and slow the energy transition. Electricity Maps’ long-term role is clear: to provide the trusted global data infrastructure that enables the energy system to become flexible, efficient, and low carbon.
“What’s missing globally is one API where you can get everything about the energy system. That’s what we’re building.”
As electrification accelerates and grids become more volatile, the world will increasingly depend on real-time intelligence to drive flexibility. Corradi’s belief is simple:
“If the market can see the real system, it will build the right solutions.”

